Lightning-fastpower systems visualisation
Advanced time series plotting for power systems engineers. Quickly analyse, visualise, and explore your power systems data, supporting all major data formats.
Auto-playing demo
Blazing Performance
Drop in series and drag them around at 60+ frames per second. Smooth zooming, panning, and interaction.
1 / 8
What else can Cute Plot do?
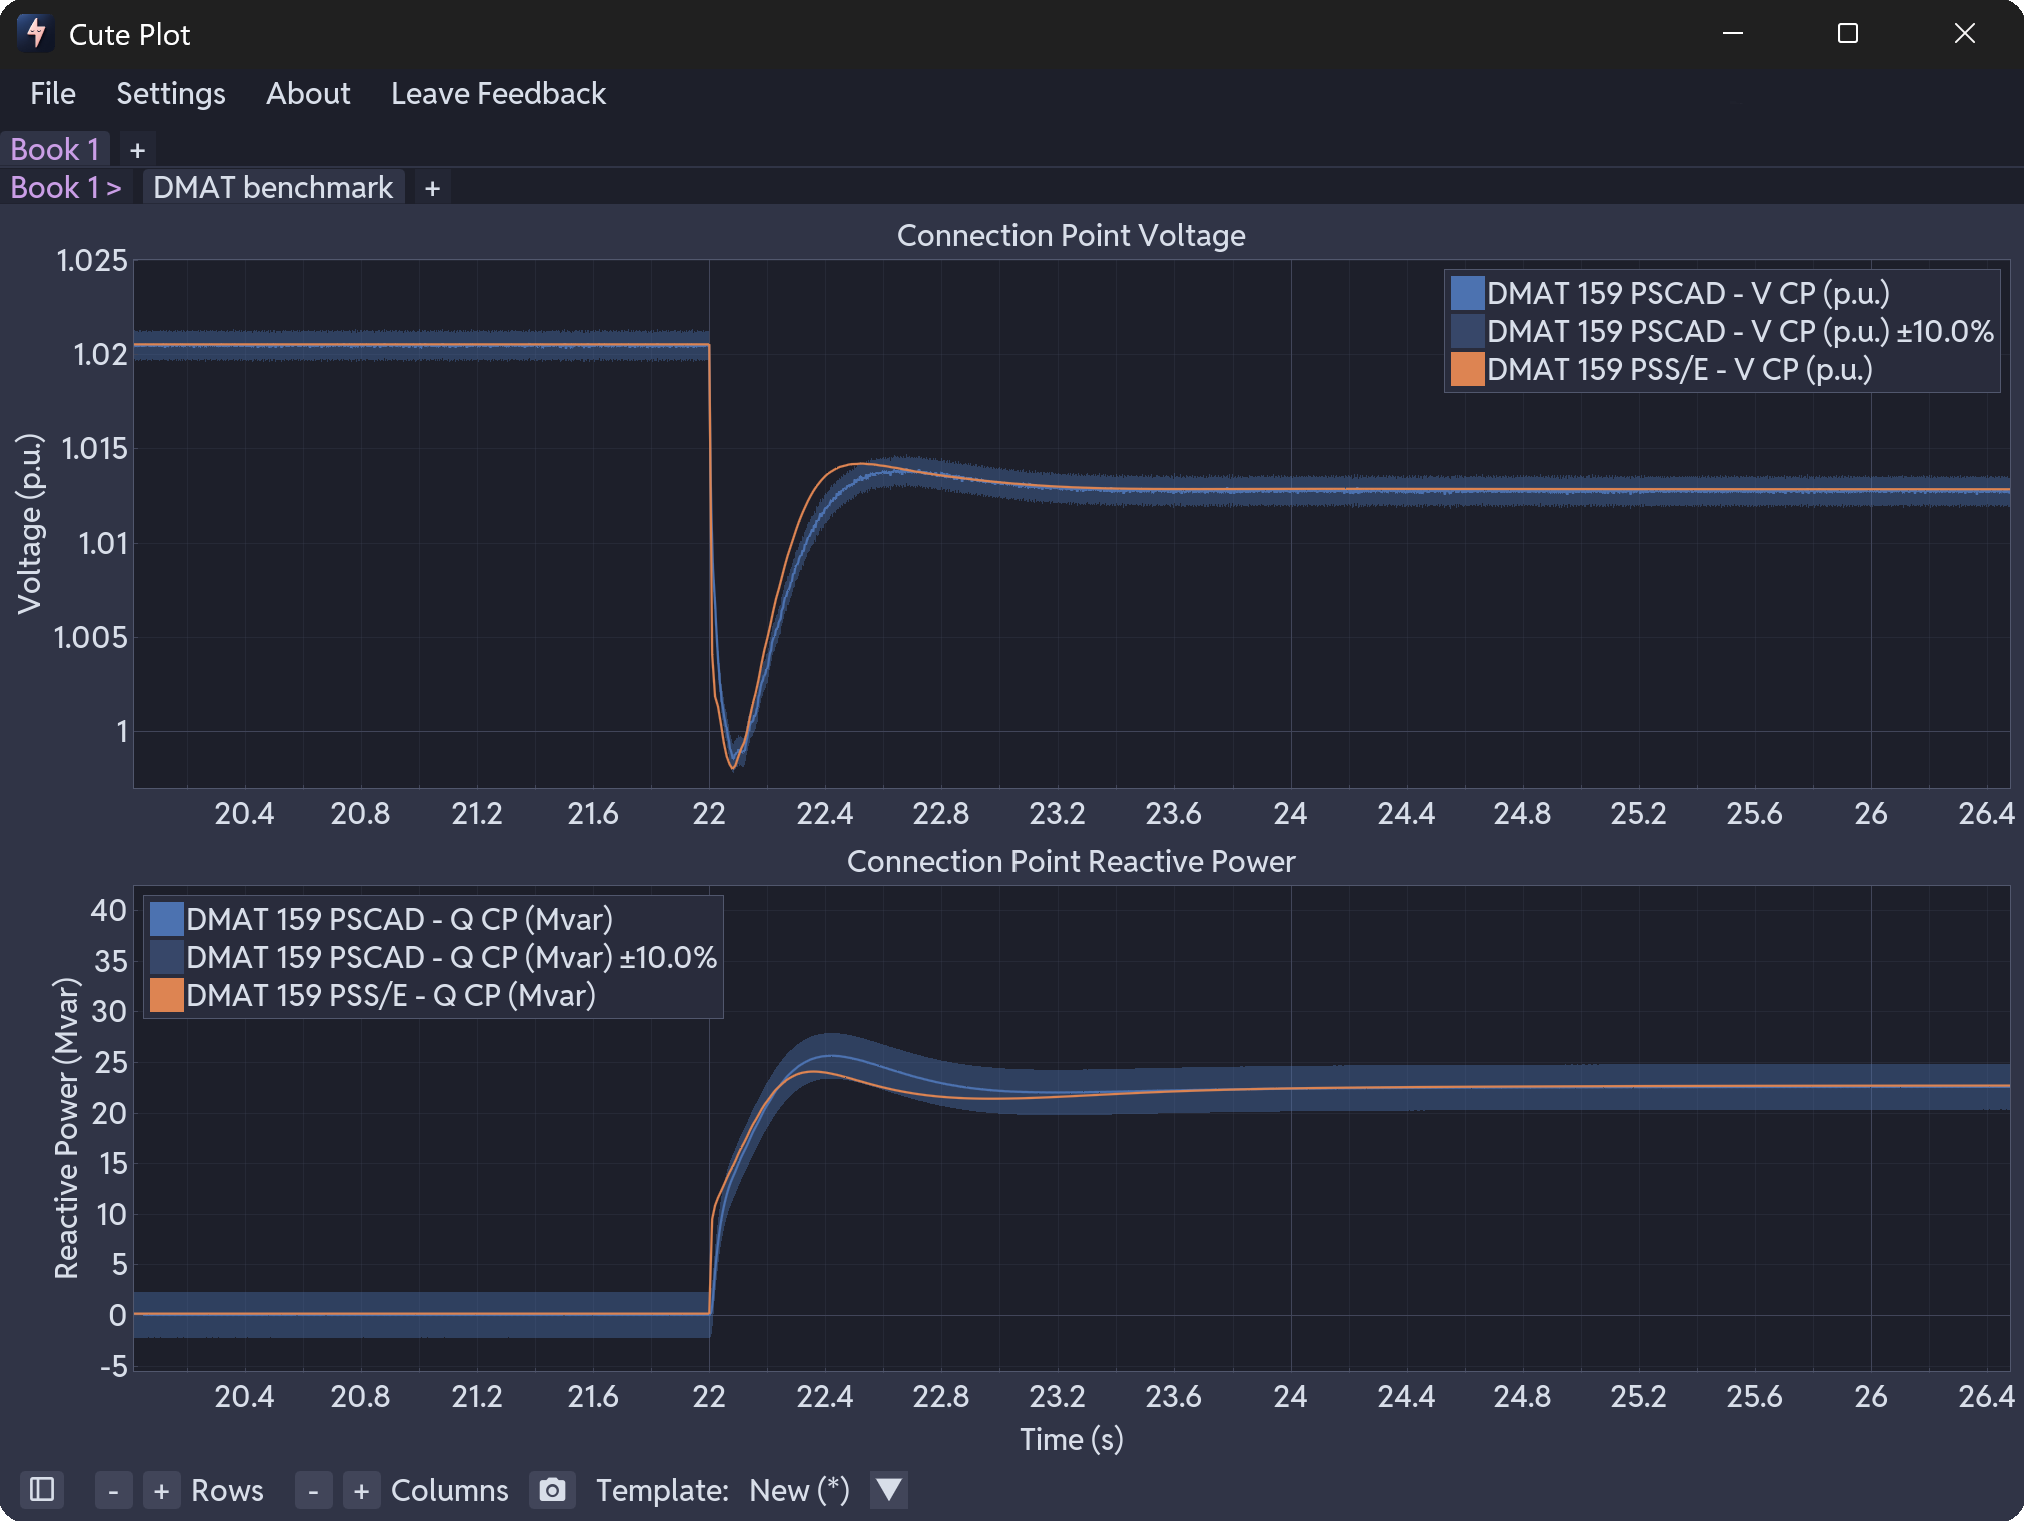
Drag and drop different files to compare scenarios. Add 10% benchmarking bands to spot differences at a glance.
1 / 8
Roadmap
Contact us for feature requests!
Q4 2025 - Closed Beta Release
Improve performance
Improve templating
Create docs
Q1 2026 - Done
Preferences pane
Faster file handling
Improved right click menus
Q2 2026 - Done
Advanced filtering
Scatter plot support
Dual y-axis
Q3 2026 - Planned
Digital series (hex codes)
Add-on support
Increased file format support
More assessment modules
Faster Excel parser
Have a feature request? Let us know what you’d like to see in Cute Plot.
Ready to revolutionise your workflow?
Problem solve, investigate and share your results faster today!